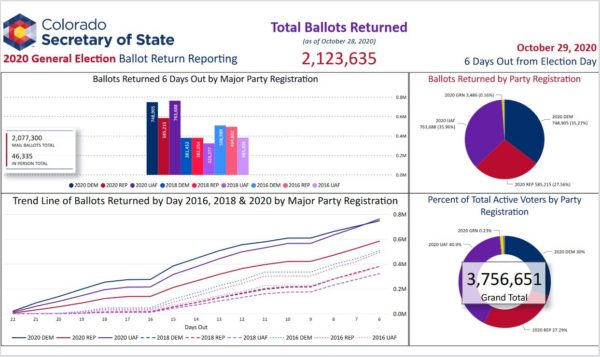
 Curious how many Colorado ballots have been returned so far this election season? This information is updated daily by the Colorado Secretary of State’s Office and is available on their website. There, you can find a daily total (as of last night at 11:30pm, 2,123,635 ballots have been returned) along with your choice of an Excel spreadsheet or a graphical summary containing more detailed data such as county, party, age, and gender. The current data shows, for instance,
- unaffiliated voters lead the political party affiliations in number of ballots returned
- the 55-64 age range leads the other age groups in number of returns
- Jefferson County voters have turned in more ballots than any other county, followed closely by Denver, El Paso, and Arapahoe
- females lead males in ballot returns, although it’s close
Looking for totals from previous elections? These can also be found on the Secretary of State’s website. Older, historical information is available in the Abstract of Votes Cast publication, which is available online from the State Publications Library back to 1904.
Latest posts by Amy Zimmer (see all)
- How to Spot the Differences Between Eagles and Hawks - August 16, 2021
- How Transportation Projects Help Tell the Story of Colorado’s Past - August 9, 2021
- Time Machine Tuesday: The Night the Castlewood Canyon Dam Gave Way - August 3, 2021