
Looking for demographic information on COVID-19 in Colorado? The State Demography Office has put together a COVID-19 map series that combines official data from various state agencies into one helpful application. The site uses maps, graphs, and other visual data tools to provide regularly-updated information on
- COVID-19 cases
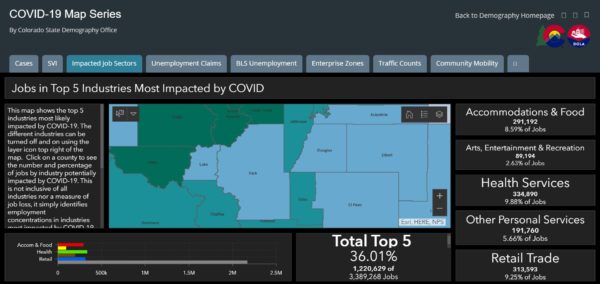
- Job impacts, affected industries, and unemployment
- Enterprise Zones and economy
- Traffic impacts
- Community mobility, which includes numbers of visits to grocery and retail stores, parks, transit stations, workplaces, etc.
- Group living situations and hospitals
- A Social Vulnerability Index, which includes socioeconomic data such as age, poverty status, minority status, limited English, and access to housing and transportation, related to COVID-19.
The map series combines official data from the Colorado Department of Public Health & Environment (CDPHE); the Colorado Department of Labor & Employment (CDLE); the Colorado Department of Transportation (CDOT); the Colorado Office of Economic Development & International Trade (OEDIT); and the Colorado Division of Homeland Security & Emergency Management (DHSEM).

Former Technical Services Librarian at State Publications Library
Latest posts by Amy Zimmer (see all)
- How to Spot the Differences Between Eagles and Hawks - August 16, 2021
- How Transportation Projects Help Tell the Story of Colorado’s Past - August 9, 2021
- Time Machine Tuesday: The Night the Castlewood Canyon Dam Gave Way - August 3, 2021