

When you are looking at your Google Analytics reports, how do you know if the numbers represent use of the website by the people you’re actually trying to serve? Many visits to your website might not be from people at all but rather from computer programs, or “bots,” crawling or scraping data from your site. The rise of Large Language Models (LLMs, often referred to as “AI”) has increased bot activity, as LLMs can require huge amounts of data obtained from the web for training their models.
The Scale of Bot Traffic
As I write this (Feb 2026), Cloudflare, one of the largest internet services providers, estimates that worldwide bot traffic currently accounts for more than 31% of all Internet traffic, and almost 45% in the United States. Imperva, a global cybersecurity firm, estimates that in 2024 automated Internet traffic accounted for 51% of all traffic, the first time bots surpassed humans in Internet traffic.
Does this mean that one third to one half of the traffic numbers you see in Google Analytics are from bots, not actual humans? Thankfully, no. Google automatically filters out from its numbers known bots and indexing spiders. Many of the bots visiting your site are Google’s own indexers. Well-behaved bots from other companies might identify themselves while crawling a site or be included on a registry of bots that Google can then use to filter analytics data.
But there are other bots that are not so well-behaved. They may not identify themselves and instead try to impersonate regular browser traffic. They may regularly shift their IP addresses so that their traffic appears to be coming from different places, or in other ways make it difficult to filter the bogus traffic of their crawls. Google can’t catch all the bot traffic and some will always get through.
Why Are Bots Crawling My Site?
There could be several reasons why bots are visiting your site. Some might simply be indexing your content for search services. These are generally considered benign bots or their indexing might even be beneficial to your site. But you still don’t want your analytics numbers to include their visits.
Other bots could be malicious. They might be crawling your site looking for security vulnerabilities or information like phone numbers or email addresses and names. Some bots might be harvesting your content for use in training LLMs. Whatever the reason for bot traffic, you don’t want it to significantly affect your analytics numbers.
How To Spot Bots in Your Traffic
Step 1: Disregard International Traffic
The first and easiest thing to do is focus on the people your website is meant to serve. You can use Google Analytics’ geographic filters to look at traffic only from those people.
If you are a local library, for example, do you really care about traffic from users in China, India, or anywhere else in the world? Conceivably there is some content on your site that could be of use to an international audience, but generally your services and information are for people in your county, district, or state, and so all international traffic can be disregarded.
You can view traffic by country in Google Analytics by looking at Reports > User Attributes > Demographic details. The chart will show the number of users over time by country. Below, for example, is part of that chart for this site for the end of 2025. I have drawn red boxes around spikes in the site’s traffic principally driven by users in China (the green line) and Singapore (the orange line).
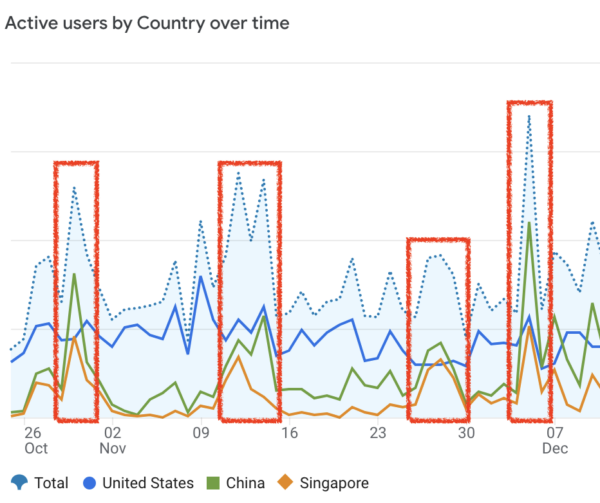
For a few days during those months traffic from China and Singapore eclipsed traffic from the United States. In total during this period, the number of users from China and Singapore constituted almost 40% of all users. This is probably just bot traffic, but even if not it is probably not traffic you really care about for your reports unless you’re trying to reach an audience in eastern Asia.
Depending on the nature of your site you might consider restricting the geographic scope of your reports even further to look at traffic from just Colorado. I often do this as a secondary report for this site, since, while the primary audience is Coloradans, it also includes content of use (we hope) to folks in other states.
Step 2: Look for Traffic Spikes from Unexpected Cities
You can use the Demographic details report to look at traffic by city as well. Add a comparison to the Demographic details chart to show only traffic from the United States, and then change the table display to show City rather than Country. The US cities that have contributed most to your traffic are automatically displayed. Take a look at the list of cities for anything unexpected and then display the data for those cities.
Below is an example of such a chart for this site for March-July 2024. The blue line is Denver–there are some ups and downs but there are no huge peaks. On the other hand, look at the numbers for Des Moines, Iowa (the green line) and Columbus, Ohio (the orange line). They show virtually no traffic except for regular spikes near 500 and up to almost 2,000 users all in a very short time.
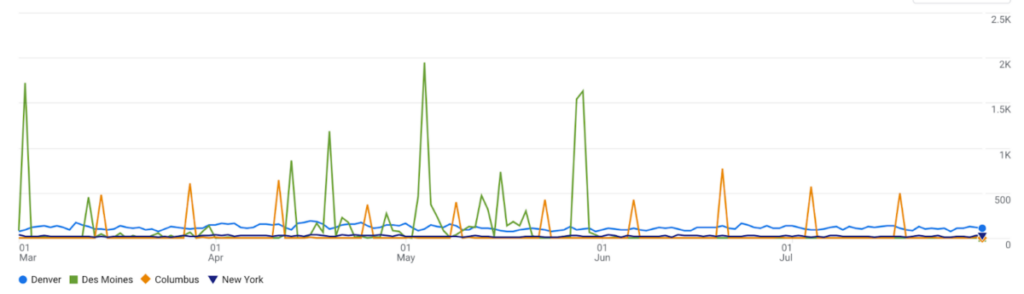
The regular spikes in traffic are almost certainly bots crawling or scraping the site. To get more accurate analytics numbers–numbers that represent the activity of people rather than bots–you should filter traffic from these cities out of your totals. This might, of course, also remove some visits from actual people from your numbers, and if you’re concerned about this you could simply subtract the high spikes instead of all traffic from those cities. But that is more labor-intensive than just excluding the cities altogether.
So How Many Bots Are We Talking About?
The total amount of bot traffic will vary from site to site, but let’s look at this site’s traffic as an example. Over the last 90 days (26 Nov 2025 through 23 Feb 2026), for all users of this site, Google Analytics has recorded 86,891 pageviews, 76,398 sessions, and 66,927 users. Beginning from those raw numbers, let’s start filtering out suspected bots and see where we end up.
The first cut is to exclude users outside of the United States. These are not all bots, of course, but probably most or many of them are and in any case it’s not an audience we’re trying to reach on this site. So let’s subtract them.
Table: Site Traffic for All users and US users only
| Metric | All users | US only | Difference |
|---|---|---|---|
| pageviews | 86,891 | 56,217 | -35% |
| sessions | 76,398 | 46,166 | -40% |
| users | 66,927 | 36,649 | -45% |
Yikes! That’s 35% of the site’s total pageviews and 45% of the site’s total users. But we’re not done yet–let’s look at traffic from US cities to see if there are any anomalous spikes that could indicate bot traffic.
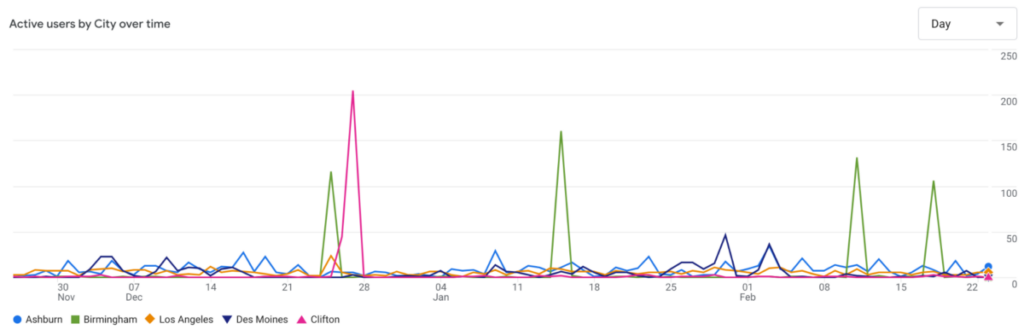
Luckily the list of traffic by city does not include many unexpected cities in the top 20. Only 4 cities show the spiky traffic pattern associated with bots: Ashburn, VA, Birmingham, AL, Des Moines, IA, and Clifton, NJ. Other cities in the top 20, like Los Angeles, Phoenix, and New York, might also count as ‘unexpected’ but their traffic doesn’t show large spikes unassociated with spikes from other cities.
Below is the chart for traffic from Ashburn (blue line), Birmingham (green line), Los Angeles (orange line), Des Moines (black line), and Clifton (pink line). The large spikes from Birmingham and Clifton are probably bots, and Ashburn and Des Moines also show uneven traffic patterns with large one-day spikes that aren’t associated with spikes from other cities. I’m guessing that’s also bot traffic.
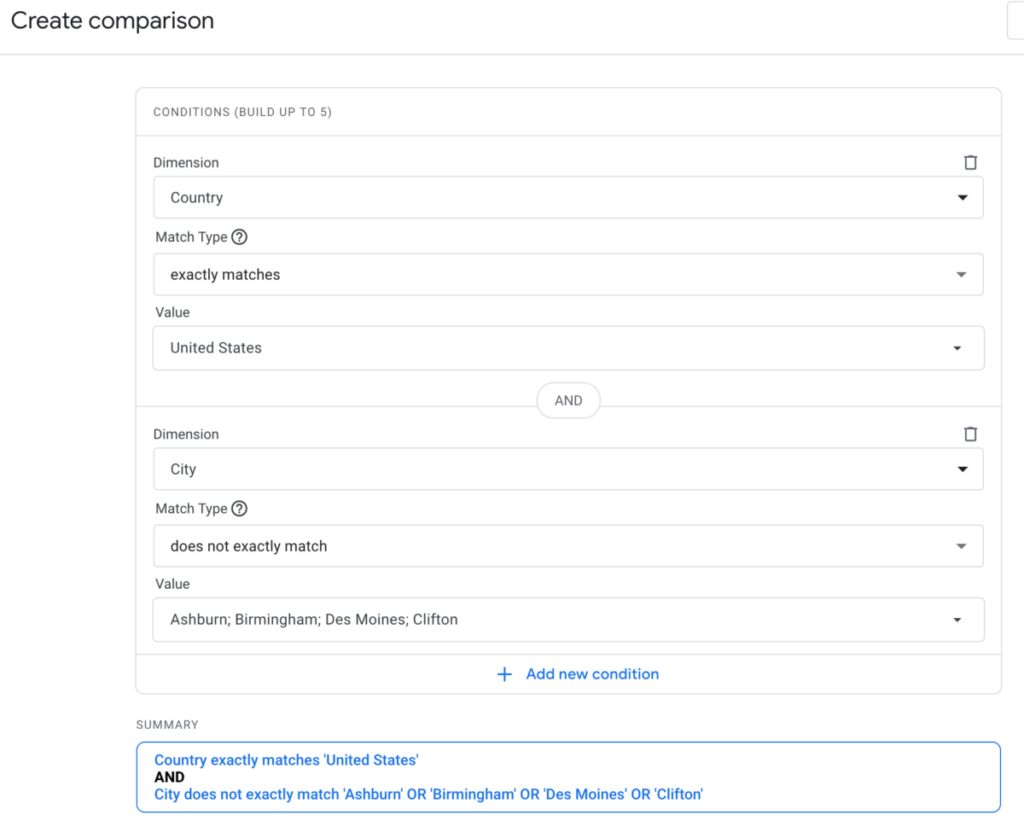
So let’s create a new comparison to exclude traffic from those cities and take another look at the resulting total. Our new comparison should have conditions so that Country exactly matches “United States” and City does not match Ashburn, Birmingham, Des Moines, or Clifton.
We can then go back to the Engagement > Events report, apply the new comparison, and compare the resulting totals. Below is the comparison for events for all US users (orange line) versus events for US users minus traffic from the cities we identified as possible bot sources (light blue line). The difference between those lines is probably bot traffic.
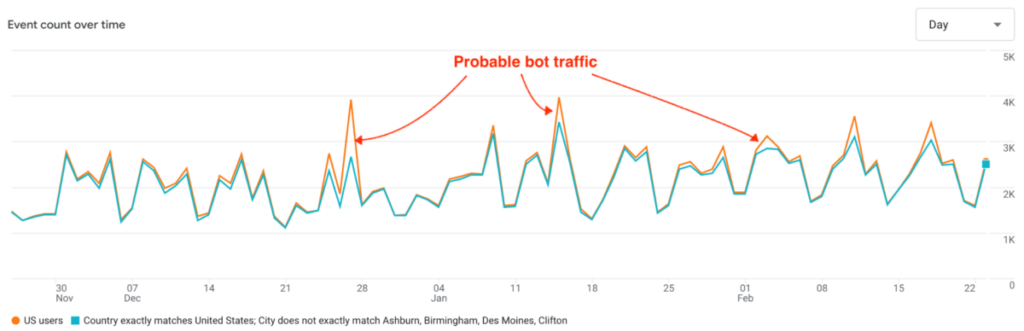
If we look at the numbers, bot traffic from US sources likely constitutes about 5% of all US traffic. There is probably more bot traffic than that, but we don’t need to be perfect here. Excluding any additional cities would only change the numbers slightly. And of course for every city you exclude you’re probably also excluding some number of actual human users.
So excluding international traffic made the largest difference to the overall numbers. But with additional exclusions for likely bot traffic from the US the total traffic numbers were reduced an additional few percentage points. Total pageviews fell 38%, sessions fell 42%, and users decreased 48%.
Table: Site Traffic for All users, US users, and US minus suspected bots
| Metric | All users | US users | US minus selected cities | Total Difference |
|---|---|---|---|---|
| pageviews | 86,891 | 56,217 | 53,733 | -38% |
| sessions | 76,398 | 46,166 | 44,079 | -42% |
| users | 66,927 | 36,649 | 34,813 | -48% |
Those are all significant differences. Especially for smaller sites with less traffic, probable bot traffic can make a big difference in the total numbers.
Should I Just Look at Colorado Users?
You could additionally restrict your analytics numbers to just users from Colorado. You might still want to look at the traffic-by-city report to look for anomalous traffic spikes, but so far I haven’t identified any such suspicious traffic patterns from Colorado users. But for some sites looking only at Colorado might be too restrictive.
If you’re a public library district, for example, many of your (actual human) users may still be using the library’s website while they are traveling or staying temporarily in different states. Depending on the internet service provider they are using they may not be correctly identified as a Colorado user. They might also be using a VPN that would mask their true IP address. The total number of these users is likely to be fairly small, but for a small site with low regular traffic, you’d still want to be sure to count them.
For some sites run by the State Library, I do find it useful to look at just Colorado users. But I report those numbers only as a subset of the numbers for all US users (minus suspected bot sources). The Colorado Historic Newspapers site, for example, shows very different patterns of use by Coloradans than by users in other states. Our Colorado users (or at least a large chunk of them) appear to have different needs when using the site than most users in other states. That’s useful information for our public outreach and product development efforts. But for most reports I do not look only at Colorado users.
Summary
Global bot traffic is estimated to be about one third to just over half of all internet traffic. The advent of LLMs and their insatiable need for training data has increased bot traffic. While Google Analytics automatically filters out known bots from your analytics numbers it can’t filter out all bot activity. Luckily, it is fairly easy to spot the large single-country or single-city spikes in traffic that can indicate significant bot activity in your analytics.
Looking at this site’s analytics numbers over the last 90 days, we filtered out users from other countries and then users from US cities that showed bot-like spikes in their traffic. This reduced the total number of users by almost half, but the vast majority of that decrease was by simply restricting the analytics numbers to users in the United States. Probable bot traffic from US cities accounted for at most about 5% of total traffic from the US.
If you work for a Colorado library, library-related organization, or cultural heritage organization and have questions about your site’s Google Analytics numbers, feel free to contact me at the email address given below. I’d be happy to help however I can.

- Global Accessibility Awareness Day - May 21, 2026
- New Federal Accessibility Rules - March 16, 2026
- Filtering Bot Traffic in Google Analytics - February 26, 2026