This is a guest post contributed by Sandy Irwin (Durango Public Library), and Katherine Weadley (Colorado Library Consortium)
It was a dark and stormy night…
We all love a good story. The tension! The excitement! Good vs. evil, right vs. wrong, dogs and cats living together…. When you hear a good story, you are engaged in its outcome. How many times have you not been able to put down a good book because you want to know what happens?
Working in or supporting libraries is an important part of our lives. We believe in libraries and the work that we accomplish. We need to learn to convey the library story to others who do not share our passion (yet). We can do this effectively through stories. This was the topic of our presentation at the 2019 Colorado Association of Libraries Conference (CALCON), where we reviewed the 13 P’s of Storytelling Power.
These tips are designed to help you share the story of your library –its successes, its failures, why support is needed and more. By incorporating stories into our presentations and reports (and in conversations with strangers at the dentist office!), you reinforce the importance of libraries and the valuable job that we do in and for our communities. If you tell an engaging story, you can influence what people care about and what they are willing to do about an issue.
Prove it! That’s the unofficial 14th “P” of storytelling that we added. It is essential to have data as a tool to support what it is you want to convey. Numbers also tell stories but in a different way. Some of your audience may be very analytical so it is important to make sure that numbers are always included. Janine Kurnoff, founder of The Presentation Company, told Forbes: “Today’s expectations of data visualization are always about the numbers telling stories.”
Numeracy, which is defined as the ability to understand probabilistic and mathematical concepts, varies dramatically from person to person and is separate from basic intelligence or level of education. Some people are more numerate than others and it is a skill that is learnable. According to Dr. Ellen Peters of the University of Oregon “Results from the National Adult Literacy Survey indicate that about half of Americans lack the minimal skills necessary to use numbers embedded in common printed materials.” (Beyond Comprehension: The Role of Numeracy in Judgments and Decisions, Current Directions in Psychological Science, January 31 2012)

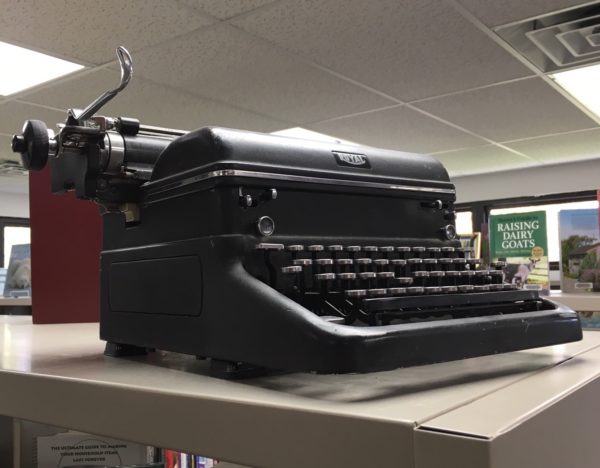
Photo Credit: Katherine Weadley
Therefore, it is important to make data as easy as possible for your audience to understand. First, decide what is you want your data to convey. Then reduce your visual clutter. Just because you can make a fancy chart doesn’t mean you should. If you need help with data collecting or presentation our Colorado library community has some outstanding and free-to-use support organizations including the Library Research Service, the State Demography Office, and the Colorado Library Consortium’s Colleague on Call service. The data used can be very simple and can take the form of any kind of visualization including pie charts, scatter plots, word clouds, or maps. Even simple data can be impactful.
However, when you tell your story, don’t lose sight of your library’s mission, vision and values. Make sure you can tie your story back to them. As shared in the 13 P’s article, avoid the perils of pandering, patronizing, and being pedantic. Just be yourself and share what is important to you, why, and the impact you and the library have on people’s lives. If you want them to do something for the library don’t forget a call to action. And share it all through a great story!
For more information:
- “What’s Your Story? Create Impact Through Smart Storytelling” Presentation (CALCON 2019)
- “What’s Your Story?” Bibliography (CALCON 2019)
- “Tell me a Story: 13 Tips and one cautionary note for powerful narratives that drive social impact” (Metropolitan Group)
For any other questions, please contact:
Sandy Irwin, Director at the Durango Public Library, or Katherine Weadley, NE Regional Consultant at the Colorado Library Consortium
- Virtual Learning for Library Trustees, April-June 2021 - April 7, 2021
- National Library Week 2021: Welcome to Your Library - April 2, 2021
- Trustee Corner – March 2021 - March 24, 2021